FULL-STACK · IMPLEMENTEDREAD-ONLY · PAPER-SAFEAnalytics
MellyTrade
Data-dense analytics and monitoring dashboard for signals, risk, and system health.
NO BROKER INTEGRATION · NO LIVE ORDER EXECUTION · NO REAL-MONEY TRADING
Portfolio maturity
IMPLEMENTED · NOT LIVE
Implemented full-stack market analytics application; read-only and paper-safe, with no broker or live order execution.
Other labels on this page describe individual surfaces and evidence, not the whole project.
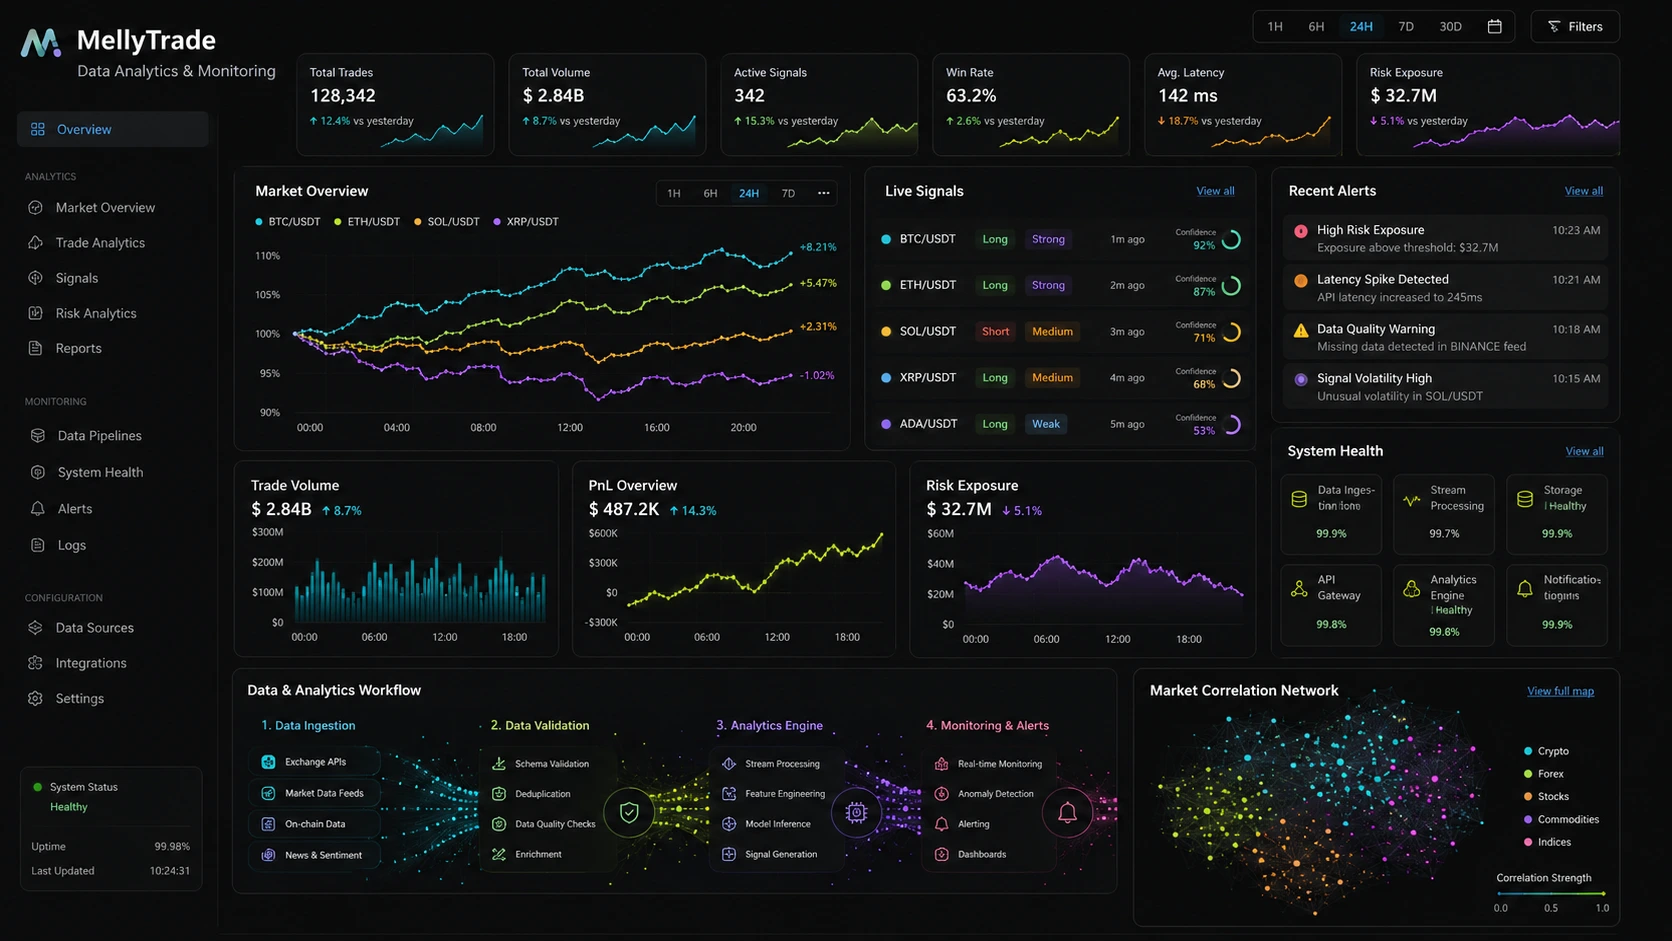
Swipe or use arrow keys to inspect the full interface.
Sample data shown in this static portfolio visual; it is not evidence of a live market connection, production deployment or trading performance.
Clarity under density
01 · Product premise
MellyTrade is an implemented full-stack market analytics application: a FastAPI and SQLAlchemy backend, a React/TypeScript/Vite frontend, and a read-only PostgreSQL/Supabase data layer, packaged with Docker and supported by Tauri/PWA surfaces and GitHub Actions.
The implemented product is intentionally read-only and paper-safe. Trading is the subject of the analytics, not an execution capability or service offer.
02 · Main dashboard
One overview screen answers the first questions an operator asks: what is happening, what needs attention, and is the system itself healthy.
03 · Information hierarchy
Summary metrics sit on top, the primary chart in the middle, and a list of signals beside it, with the data workflow beneath. Reading order follows urgency, and type scale carries the rest.
04 · Signal / risk presentation
Signals are shown with direction, strength and a confidence indicator; risk exposure is a headline metric, and a threshold breach becomes a ranked alert. Each carries a text label, so meaning never depends on colour alone.
05 · Alerting / health presentation
Alerts are ranked and timestamped, with the reason stated in a sentence, so a data problem is visible before it becomes a signal problem.
06 · Data / system workflow
Four stages, one direction: data comes in, is validated, is analysed, and is monitored — with alerting as the visible end of the chain.
- Data ingestion
- Data validation
- Analytics engine
- Monitoring & alerts — key stage
07 · Design language
A dark, quiet canvas so that data — not chrome — carries the colour. The screenshot uses its own palette; the portfolio around it stays neutral.
08 · Project status
IMPLEMENTED · PUBLIC SOURCE · PAPER-SAFE
The public repository contains the full-stack application; a closed-beta pre-release and public frontend demo are documented project evidence. The portfolio visual above is sample-only and does not claim production traffic, live market connectivity, profitability or users.
Live order execution is blocked by design, there is no broker integration, and no real-money trading capability or result is claimed.